Websocket Real Time Monitor
Where you can find it:
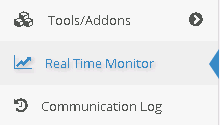
The Websocket Real Time Monitor action can be found on the left-side menu: it is placed just between the Tools/Addons and the Communication Log.
Usage:
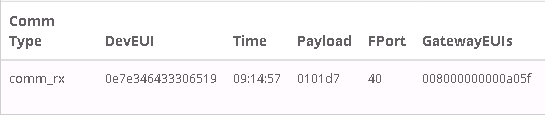
The Real Time Monitor displays a table where, in real time, the Rx sent to your WebSocket will be stored. It shows all the fields and the values contained in the Rx.
You may also see the recieved Payload decoded and structured in JSON format.
Note: Decoded Payload Example:
["{\"altitude\":0,\"latitude\":0,\"loRaSNR\":8.5,\"longitude\":0,\"mac\":\"008000000000a05f\",\"name \":\"008000000000a05f\",\"rssi\":-73,\"time\":\"2017-05-12T07:31:59.214453Z\"}"]
Quick Tx:
You can also send a quick Tx to a choosen device. Just select the Node and the Connector, insert the Data and the Port.