How to create a Chart Widget
Where can you do it?
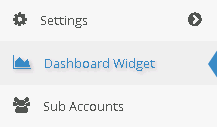
You can create a chart widget by clicking on Dashboard Widget in the left-side menu at the bottom.
How can you do it?
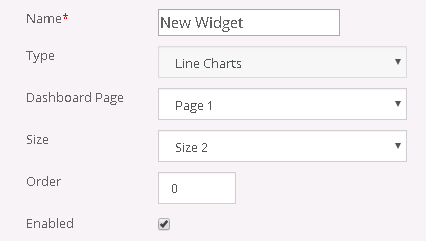
A new page opens which contains a form for the standard infos that describe your widget, you can choose:
- a name
- the page where the widget will be displayed
- the size of the widget
- the order value, this sets the position in the page based on other widgets order values
- the visibility
- other fields based on which type of widget you've chosen
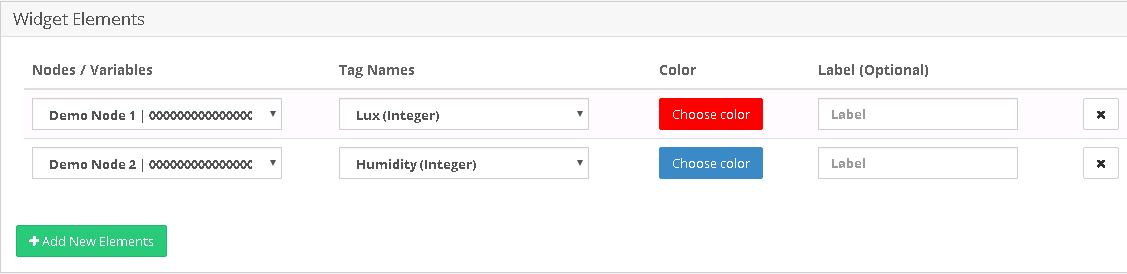
Now you can add the widget elements, these can be nodes, gateways or variables from which the input data for the widget is taken.
You choose the element from a menu and one of its tags if the element is not a variable (in order to show the data contained in it).
Some of these fields may differ from a type of widget to another.
 (This example is taken from the map widget)
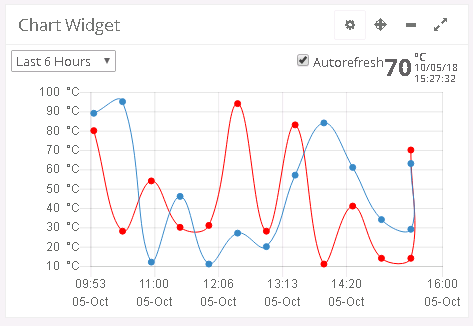
The final result